Control charts are the most powerful tool in statistical process control, enabling organizations to monitor process stability, detect variation, and make data-driven decisions about when to act and when to leave processes alone. Developed by Walter Shewhart at Bell Laboratories in the 1920s, control charts remain essential for quality professionals across every industry in 2026.
This comprehensive control charts guide covers every type of control chart, when to use each one, how to interpret results correctly, and common mistakes that lead to wrong conclusions. Whether you’re a quality engineer monitoring manufacturing processes or a healthcare professional tracking patient outcomes, mastering control charts transforms your ability to improve quality systematically.
Understanding control charts separates reactive firefighting from proactive process management. Organizations that master control charts reduce defects, lower costs, and achieve consistent quality that builds customer confidence and competitive advantage.
What Are Control Charts?
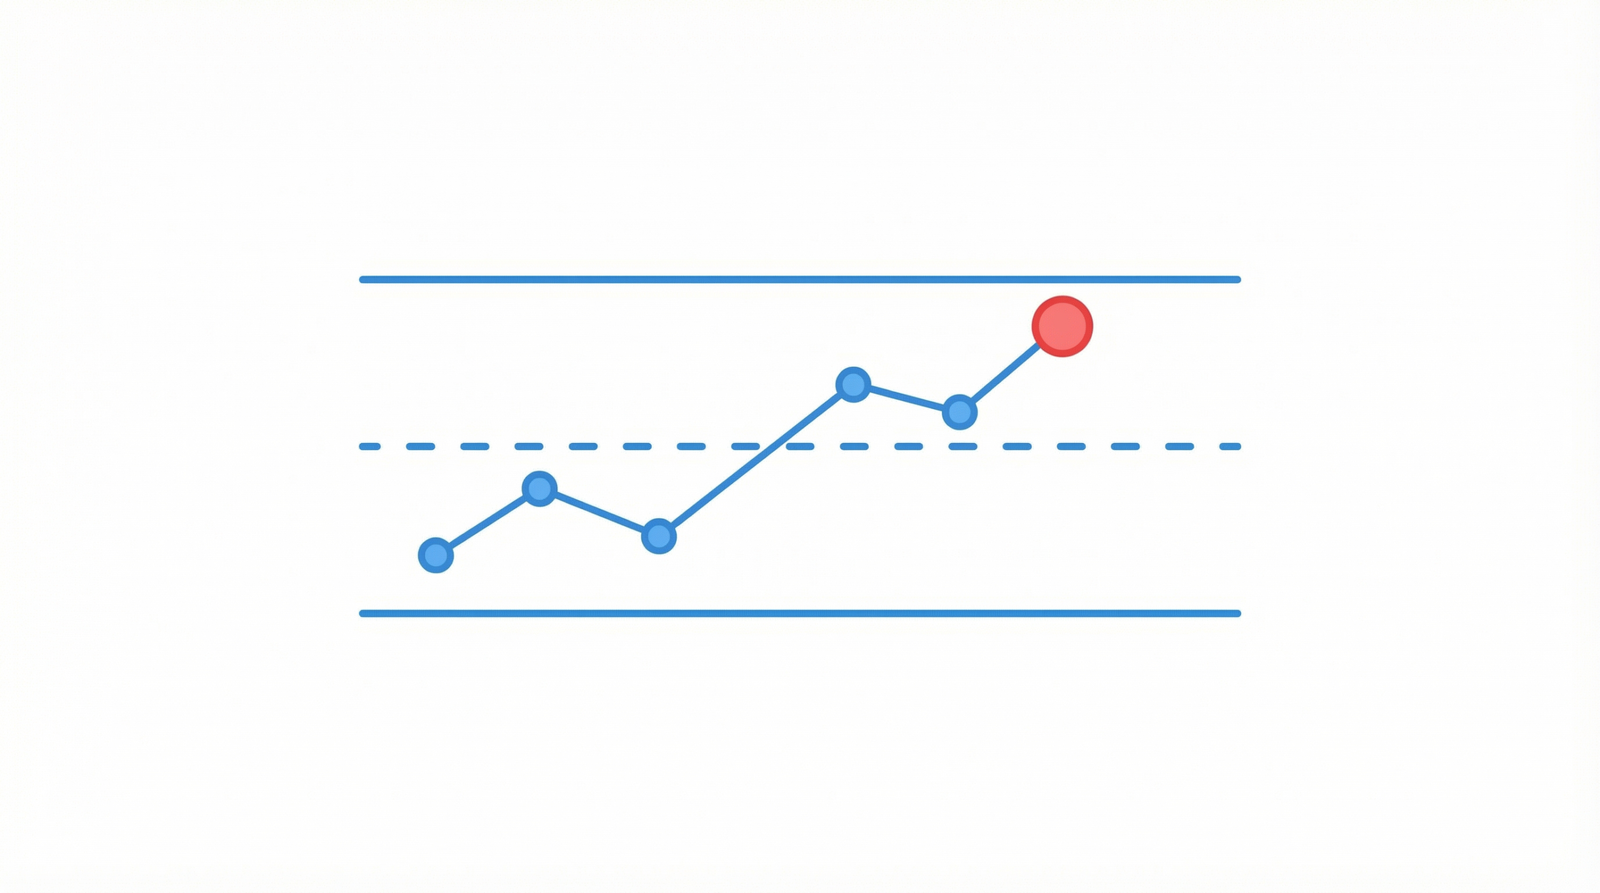
Control charts are graphical tools that plot process data over time against statistically calculated control limits. They distinguish between two types of variation that require fundamentally different management responses.
Common Cause vs Special Cause Variation
| Variation Type | Description | Correct Response | Example |
|---|---|---|---|
| Common Cause | Natural, inherent variation always present | Improve the system (management action) | Normal temperature fluctuation in oven |
| Special Cause | Unusual variation from identifiable source | Find and eliminate the cause (local action) | Thermocouple failure causing temperature spike |
This distinction is the foundation of control charts. As W. Edwards Deming emphasized, confusing these two types of variation leads to tampering (over-adjustment) or neglect (under-reaction), both of which worsen quality.
Control Chart Components
Every control chart contains these essential elements:
- Center Line (CL): Average or median of the process data representing typical performance
- Upper Control Limit (UCL): Typically set at +3 standard deviations from center line
- Lower Control Limit (LCL): Typically set at -3 standard deviations from center line
- Data Points: Individual measurements or subgroup statistics plotted in time order
Control charts use ±3 sigma limits because they capture 99.73% of natural variation. Points outside these limits signal special cause variation with very high confidence.
Types of Control Charts
Selecting the right control chart depends on your data type and sampling strategy. This section covers every control chart type with clear guidance on when to use each one.
Variables Control Charts (Continuous Data)
Variables control charts monitor measurable, continuous data like temperature, weight, length, or time. These control charts provide the most statistical information about your process.
X-bar and R Chart (Subgroup Averages and Ranges)
When to Use This Control Chart:
- Subgroup sizes of 2-10 (typically 4-5)
- Rational subgroups collected at regular intervals
- Most common control chart in manufacturing
How It Works:
- X-bar chart plots subgroup averages monitoring process centering
- R chart plots subgroup ranges monitoring process spread
- Always interpret the R chart first because unstable variation invalidates the X-bar chart
Control Limits Calculation:
- X-bar UCL = X-double-bar + A2 × R-bar
- X-bar LCL = X-double-bar – A2 × R-bar
- R UCL = D4 × R-bar
- R LCL = D3 × R-bar
Best Applications:
- Monitoring dimensional measurements in machining operations
- Tracking fill weights in packaging processes
- Measuring cycle times in manufacturing
- Monitoring chemical concentrations in process industries
X-bar and S Chart (Subgroup Averages and Standard Deviations)
When to Use This Control Chart:
- Subgroup sizes greater than 10
- When more precise variation estimate needed than range provides
- Automated data collection generating larger subgroups
How It Works:
- X-bar chart plots subgroup averages (same as X-bar and R)
- S chart plots subgroup standard deviations instead of ranges
- Standard deviation provides better estimate of variation for larger subgroups
Best Applications:
- High-volume automated inspection systems generating large samples
- Laboratory testing with multiple replicate measurements
- Call center response time monitoring with many daily observations
Individual and Moving Range Chart (I-MR or X-MR)
When to Use This Control Chart:
- Individual measurements (subgroup size = 1)
- Expensive or destructive testing where only one measurement per period
- Batch processes with one result per batch
- Slow processes with long intervals between measurements
How It Works:
- Individuals chart plots each single measurement
- Moving Range chart plots the absolute difference between consecutive measurements
- Moving Range typically uses span of 2 consecutive points
Control Limits Calculation:
- I UCL = X-bar + 2.66 × MR-bar
- I LCL = X-bar – 2.66 × MR-bar
- MR UCL = 3.267 × MR-bar
- MR LCL = 0
Best Applications:
- Chemical batch analysis (one test per batch)
- Monthly financial metrics
- Environmental measurements (daily temperature, humidity)
- Destructive testing where each test consumes the sample
Attributes Control Charts (Count Data)
Attributes control charts monitor count data including defective items, defects per unit, or pass/fail results. These control charts apply when measurement data is unavailable or impractical.
P Chart (Proportion Defective)
When to Use This Control Chart:
- Tracking proportion (percentage) of defective items
- Variable subgroup sizes acceptable
- Each item classified as defective or non-defective (pass/fail)
How It Works:
- Plots the proportion defective (p) for each subgroup
- Control limits adjust automatically for varying subgroup sizes
- Based on binomial distribution
Best Applications:
- Percentage of defective products in daily production
- Patient infection rates in hospitals
- Email delivery failure rates
- Proportion of customer orders with errors
NP Chart (Number Defective)
When to Use This Control Chart:
- Tracking count of defective items (not proportion)
- Constant subgroup size required
- Simpler interpretation than P chart when subgroup sizes are equal
How It Works:
- Plots the number of defective items per subgroup
- Requires constant sample size for valid control limits
- More intuitive than proportions for shop floor operators
Best Applications:
- Number of defective units per shift (constant production volume)
- Failed inspections per batch (constant batch size)
- Number of incorrect invoices per day (constant volume)
C Chart (Count of Defects)
When to Use This Control Chart:
- Counting defects (not defectives) per inspection unit
- Constant inspection area, length, volume, or time
- Multiple defects possible per unit
How It Works:
- Plots the count of defects per constant-size inspection unit
- Based on Poisson distribution
- Opportunity for defects must remain constant
Best Applications:
- Scratches per painted panel (constant panel size)
- Typos per document page
- Solder defects per circuit board (same board type)
- Potholes per mile of highway
U Chart (Defects Per Unit)
When to Use This Control Chart:
- Counting defects per unit when inspection unit size varies
- Variable area, length, volume, or time between inspections
- Most flexible attributes control chart
How It Works:
- Plots defects per unit (u = c/n) for each subgroup
- Normalizes defect count by inspection unit size
- Control limits adjust for varying inspection areas
Best Applications:
- Defects per square meter of fabric (varying roll sizes)
- Errors per 1,000 lines of code (varying module sizes)
- Contamination events per production hour (varying run lengths)
Advanced Control Charts
CUSUM Chart (Cumulative Sum)
When to Use This Control Chart:
- Detecting small sustained shifts in process mean (0.5-2.0 sigma)
- When Shewhart charts may be too slow to detect gradual drift
- Critical processes where small changes have significant impact
How It Works:
- Accumulates deviations from target value over time
- V-mask or tabular form identifies when cumulative shift exceeds threshold
- Much more sensitive to small persistent shifts than standard control charts
Best Applications:
- Chemical process monitoring where gradual drift is critical
- Pharmaceutical potency monitoring
- Precision manufacturing with tight tolerances
EWMA Chart (Exponentially Weighted Moving Average)
When to Use This Control Chart:
- Detecting small to moderate shifts in process mean
- When individual measurements used (similar to I-MR chart)
- When data may not be perfectly normally distributed
How It Works:
- Weighted average giving more weight to recent data
- Smoothing parameter (lambda) controls sensitivity
- Robust to non-normality assumptions
Best Applications:
- Financial process monitoring
- Service level agreement tracking
- Environmental monitoring with autocorrelated data
Control Chart Selection Guide
Choosing the correct control chart is critical. Use this decision framework to select the right one every time.
| Data Type | Subgroup Size | What You’re Tracking | Control Chart |
|---|---|---|---|
| Variables (continuous) | 2-10 | Process average and spread | X-bar and R |
| Variables (continuous) | 10+ | Process average and spread | X-bar and S |
| Variables (continuous) | 1 | Individual measurements | I-MR |
| Attributes (pass/fail) | Variable | Proportion defective | P chart |
| Attributes (pass/fail) | Constant | Number defective | NP chart |
| Attributes (count) | Constant area | Defects per unit | C chart |
| Attributes (count) | Variable area | Defects per unit | U chart |
| Variables | Any | Small shifts detection | CUSUM or EWMA |
How to Interpret Control Charts
Creating control charts is straightforward. Interpreting them correctly separates effective quality professionals from those who misuse data. These rules apply to all control chart types.
The 8 Western Electric Rules for Control Charts
The Western Electric rules identify patterns indicating special cause variation on control charts:
Rule 1: Point Beyond Control Limits
Signal: Any single point above UCL or below LCL
Meaning: Strong evidence of special cause variation
Action: Investigate immediately and identify assignable cause
Rule 2: Nine Points on Same Side of Center Line
Signal: Nine or more consecutive points above or below center line
Meaning: Process mean has likely shifted
Action: Investigate cause of sustained shift
Rule 3: Six Points Trending
Signal: Six consecutive points steadily increasing or decreasing
Meaning: Process drifting in one direction (tool wear, material degradation)
Action: Identify and address drift cause before limits exceeded
Rule 4: Fourteen Points Alternating
Signal: Fourteen consecutive points alternating up and down
Meaning: Two sources of variation systematically alternating (two machines, two operators)
Action: Investigate stratification source
Rule 5: Two of Three Points Beyond 2-Sigma
Signal: Two out of three consecutive points beyond 2-sigma warning limits (same side)
Meaning: Early warning of potential shift
Action: Increase monitoring frequency and investigate
Rule 6: Four of Five Points Beyond 1-Sigma
Signal: Four out of five consecutive points beyond 1-sigma (same side)
Meaning: Small but persistent shift likely occurring
Action: Investigate subtle process change
Rule 7: Fifteen Points Within 1-Sigma (Hugging Center Line)
Signal: Fifteen consecutive points within ±1 sigma of center line
Meaning: Variation has decreased or control limits calculated incorrectly
Action: Verify control limit calculations or recalculate with current data
Rule 8: Eight Points Beyond 1-Sigma (Both Sides)
Signal: Eight consecutive points beyond 1-sigma on both sides with none in zone C
Meaning: Mixture pattern indicating two or more process streams combined
Action: Stratify data by source to identify distinct process streams
Control Charts Step-by-Step Implementation
Follow this proven process to implement control charts effectively in your organization.
Step 1: Select the Process and Characteristic
- Choose a process critical to quality, cost, or customer satisfaction
- Select a measurable characteristic that reflects process performance
- Ensure measurement system is adequate using Measurement System Analysis techniques
Step 2: Plan Data Collection
- Rational Subgrouping: Group measurements likely to be similar within subgroup and different between subgroups
- Subgroup Size: Typically 4-5 for variables control charts
- Frequency: Often enough to detect changes but practical for operations
- Sample Size: Collect minimum 20-25 subgroups before calculating control limits
Step 3: Collect Initial Data
- Collect data during normal operating conditions
- Record relevant process information (operator, material lot, machine, time)
- Do not adjust the process during initial data collection
- Document any known events or changes
Step 4: Calculate Control Limits
- Calculate center line (average) and control limits using appropriate formulas
- Use standard control chart constants (A2, D3, D4, etc.) from statistical tables
- Plot the data and examine for stability
- Remove special cause points and recalculate if needed
Step 5: Interpret and Respond
- Apply Western Electric rules to identify signals
- Investigate all special cause signals promptly
- Document assignable causes and corrective actions
- Implement error-proofing solutions where possible
Step 6: Maintain and Improve
- Continue plotting data on established control charts
- Recalculate limits only when process fundamentally changes
- Review control charts regularly in team meetings
- Use control chart data for process capability analysis
Control Charts and Process Capability
Control charts tell you if your process is stable. Process capability analysis tells you if your stable process meets specifications. Both are essential for quality management.
Process Capability Indices
| Index | What It Measures | Formula Concept | Target |
|---|---|---|---|
| Cp | Potential capability (spread only) | Spec width / Process width | ≥ 1.33 |
| Cpk | Actual capability (spread + centering) | Distance to nearest spec / Half process width | ≥ 1.33 |
| Pp | Overall performance (long-term) | Similar to Cp using overall variation | ≥ 1.33 |
| Ppk | Overall performance with centering | Similar to Cpk using overall variation | ≥ 1.33 |
Critical Rule: Never calculate process capability from an unstable process. Control charts must show statistical control before capability indices are meaningful.
Capability Interpretation
| Cpk Value | Interpretation | Approximate DPMO | Action Required |
|---|---|---|---|
| < 1.00 | Not capable | > 2,700 | Urgent improvement needed |
| 1.00 – 1.33 | Marginally capable | 66 – 2,700 | Improvement recommended |
| 1.33 – 1.67 | Capable | 0.6 – 66 | Monitor and maintain |
| > 1.67 | Highly capable | < 0.6 | World-class performance |
Control Charts in Different Industries
Control charts apply universally across industries. These examples demonstrate diverse applications.
Manufacturing
- Dimensional Control: X-bar and R charts monitoring part dimensions on CNC machines
- Fill Weight: I-MR charts tracking packaging fill weights
- Defect Rates: P charts monitoring daily reject percentages
- Surface Quality: C charts counting surface defects per unit area
Healthcare
- Infection Rates: U charts tracking hospital-acquired infections per 1,000 patient days
- Wait Times: I-MR charts monitoring emergency department wait times
- Medication Errors: P charts tracking error rates per shift
- Lab Turnaround: X-bar and R charts monitoring test result delivery times
Healthcare organizations implementing quality systems like ISO 13485 for medical devices use control charts extensively for process validation and ongoing monitoring.
Service Industries
- Call Center: I-MR charts monitoring average handle time per day
- Financial: P charts tracking transaction error rates
- Logistics: X-bar and R charts monitoring delivery times
- Software: C charts counting defects per release
Food and Beverage
- Temperature: I-MR charts monitoring critical control point temperatures
- pH Levels: X-bar and R charts tracking product acidity
- Microbiology: C charts monitoring colony counts per sample
- Weight: X-bar and R charts verifying product fill weights
Common Control Chart Mistakes
Even experienced professionals make these control chart errors. Avoid them to ensure valid process monitoring.
Mistake 1: Putting Specification Limits on Control Charts
Problem: Confusing control limits with specification limits. They are fundamentally different.
Why It’s Wrong: Control limits come from process data (voice of the process). Specification limits come from customer requirements (voice of the customer). Mixing them causes wrong decisions.
Correct Approach: Never put specification limits on control charts. Use separate capability analysis to compare process performance against specifications.
Mistake 2: Recalculating Limits Too Frequently
Problem: Recalculating control limits with every new data point.
Why It’s Wrong: Constantly moving control limits defeats their purpose of detecting change. Limits should represent the stable process baseline.
Correct Approach: Calculate control limits from initial stable data period. Recalculate only when the process has fundamentally and permanently changed.
Mistake 3: Ignoring Non-Random Patterns
Problem: Only looking for points beyond control limits while ignoring trends, runs, and patterns.
Why It’s Wrong: Non-random patterns signal special causes even when all points remain within limits.
Correct Approach: Apply all Western Electric rules systematically, not just Rule 1.
Mistake 4: Wrong Chart Selection
Problem: Using X-bar and R charts for individual measurements or P charts for continuous data.
Why It’s Wrong: Control limit calculations assume specific data distributions. Wrong chart type produces invalid limits.
Correct Approach: Use the selection guide above to match chart type to your data characteristics.
Mistake 5: Inadequate Subgroup Strategy
Problem: Forming subgroups based on convenience rather than rational statistical principles.
Why It’s Wrong: Poor subgrouping masks special causes within subgroups or creates false signals between subgroups.
Correct Approach: Form rational subgroups where within-subgroup variation represents common cause only. Consecutive parts from same machine, operator, and material lot create good subgroups.
Mistake 6: Not Acting on Signals
Problem: Plotting control charts but never investigating or acting on signals.
Why It’s Wrong: Control charts are decision tools, not wall decorations. Their value comes from driving action.
Correct Approach: Establish clear response procedures for each type of signal. Assign responsibility for investigation and follow-up.
Control Chart Software Tools
Modern software makes creating and maintaining control charts efficient. These tools handle calculations and generate professional control charts automatically.
| Software | Control Chart Capabilities | Best For | Price |
|---|---|---|---|
| Minitab | All chart types, capability, real-time SPC | Industry standard for quality professionals | $1,610/year |
| JMP (SAS) | Interactive control charts, advanced analytics | Engineers and scientists | $1,785/year |
| InfinityQS | Enterprise SPC, real-time monitoring | Large manufacturing operations | Custom pricing |
| SPC XL | Excel-based control charts | Organizations using Excel | $249 one-time |
| R (free) | Complete SPC packages (qcc, SixSigma) | Advanced users wanting free solution | Free |
| Excel | Basic control charts with manual setup | Quick analysis and learning | Microsoft 365 |
For comprehensive software comparisons including quality management platforms, visit our best quality management software guide.
Control Charts and Quality Standards
Control charts are referenced or required in major quality management standards worldwide.
ISO 9001
Clause 9.1 requires monitoring and measurement of processes. Control charts satisfy this requirement by providing objective evidence of process performance over time. Our ISO 9001 checklist includes process monitoring verification.
ISO 13485 Medical Devices
Process validation requires demonstrated statistical control. Control charts provide ongoing evidence that validated processes remain in their validated state.
IATF 16949 Automotive
Statistical process control is explicitly required for all special characteristics. Control charts are the primary tool for meeting this requirement in automotive manufacturing.
FDA Process Validation
FDA guidance requires continued process verification using statistical techniques. Control charts demonstrate that commercial manufacturing processes remain in a state of control.
Control Charts Best Practices
Follow these proven practices to maximize value from your control chart implementation.
1. Start with Critical Processes
Don’t try to chart everything. Identify 5-10 critical quality characteristics where control charts deliver the most value. Expand gradually as your team builds competence.
2. Train Everyone Who Uses Control Charts
Operators plotting data must understand what control charts tell them and how to respond to signals. Managers reviewing control charts must understand variation types and avoid overreacting to common cause variation.
3. Make Charts Visible
Display control charts at the point of use where operators can see and update them. Visibility drives engagement and rapid response to signals.
4. Establish Response Procedures
Document clear procedures for responding to out-of-control signals including who investigates, what records to complete, and escalation paths.
5. Review Regularly
Include control chart review in daily quality meetings and management reviews. Trends visible on control charts should drive improvement priorities as part of your Total Quality Management approach.
6. Connect to Improvement
Use control chart data to identify improvement opportunities. Stable but not capable processes need fundamental improvement. Unstable processes need special cause elimination first.
Recommended Control Chart Books
Deepen your control chart expertise with these essential resources:
- “Understanding Statistical Process Control” by Donald J. Wheeler — The most practical SPC book ever written. Essential for mastering control chart interpretation.
- “Introduction to Statistical Quality Control” by Douglas C. Montgomery — Comprehensive textbook covering all control chart types with mathematical rigor.
- “SPC for the Rest of Us” by Hy Pitt — Makes control charts accessible to non-statisticians.
For complete reading recommendations, explore our statistical quality control books guide and our Six Sigma books collection covering the DMAIC methodology where control charts play a critical role in the Control phase.
Conclusion: Master Control Charts for Quality Excellence
Control charts remain the most powerful tool available for understanding and managing process variation. In an era of big data and artificial intelligence, the fundamental principles of control charts established by Walter Shewhart nearly a century ago continue providing unmatched practical value.
Mastering control charts enables you to distinguish between variation requiring action and variation that should be left alone. This distinction prevents the costly mistakes of tampering with stable processes and ignoring genuine process changes.
Start by selecting one critical process, choosing the appropriate control chart type, collecting data systematically, and interpreting results using established rules. Build organizational competence gradually, expanding control chart usage as your team develops confidence and skill.
Whether you’re monitoring manufacturing dimensions, tracking healthcare outcomes, or managing service quality metrics, control charts provide the objective, data-driven foundation for continuous improvement and quality excellence.
Ready to implement control charts in your organization? Begin with our selection guide above, choose your most critical process, and start monitoring. The insights you gain from properly implemented control charts will transform your approach to quality management and drive measurable improvement in 2026 and beyond.